This sketch, scaled 10 mm. to a foot, shows how wrong and unscientific nearsighted glasses are at every foot, inside of twenty feet, regardless of the Rx, or what is looked at. Note particularly 1 foot, 5 feet, 10 feet, and 15 feet; also the 20 foot distance at which all nearsighted glasses are fitted.
 1 foot    - 20   times wrong
 2 feet    - 19/20 times wrong
 3 feet    - 18/20 times wrong
 4 feet    - 17/20 times wrong
 5 feet    - 16/20 times wrong
 6 feet    - 15/20 or 3/4 times wrong
 7 feet    - 13/20 times wrong
 8 feet    - 12/20 times wrong
 9 feet    - 11/20 times wrong
10 feet    - 10/20 or 1/2 times wrong
11 feet    - 9/20 times wrong
12 feet    - 8/20 times wrong
13 feet    - 7/20 times wrong
14 feet    - 6/20 times wrong
15 feet    - 5/20 or 1/4 times wrong
16 feet    - 4/20 times wrong
17 feet    - 3/20 times wrong
18 feet    - 2/20 times wrong
19 feet    - 1/20 times wrong
20 feet    - The distance all nearsighted glasses are fitted
To infinity
(While the above may not seem to be optically correct to some, it is near enough to give an idea of why nearsighted glasses are wrong and unscientific, especially incases of children, and young people under the age of thirty-five.)
The following graphs are designed according to a new theory and method for eyes, to show the past present and future of any eye or eyes, where the history of the case is known, or the present and future, where the history is not known, but can be assumed, according to experience in the field of eye work.
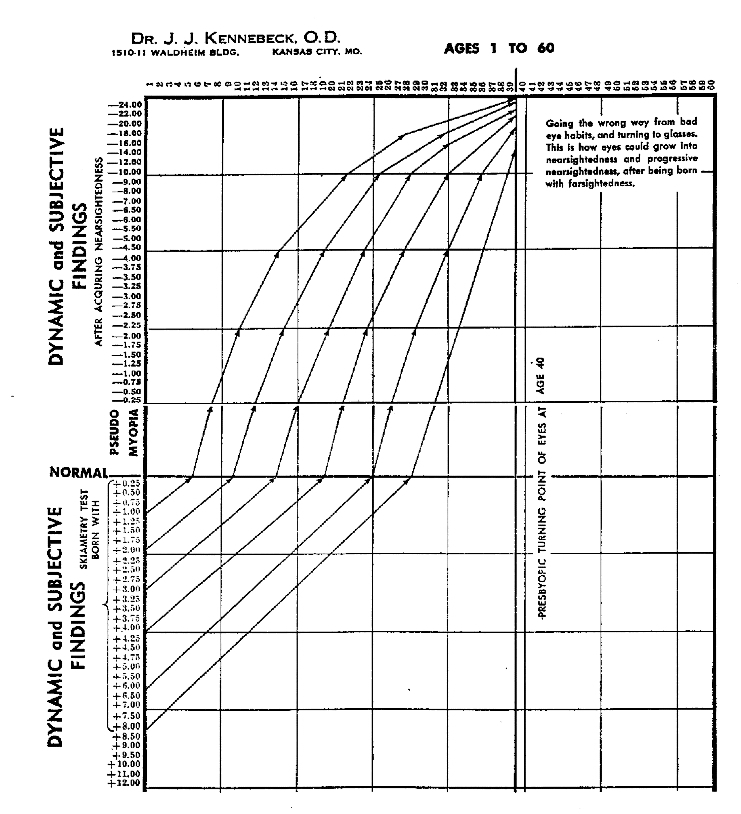
The graph shows that the more or less bad eyes of the past, present and future, largely and in the most part, are due to the misuse of eyes in the-beginning, and using glasses as the remedy thereafter, in place of being shown how not to misuse eyes in the beginning, and for want, or need, of a better remedy for eyes in the beginning, and thereafter.
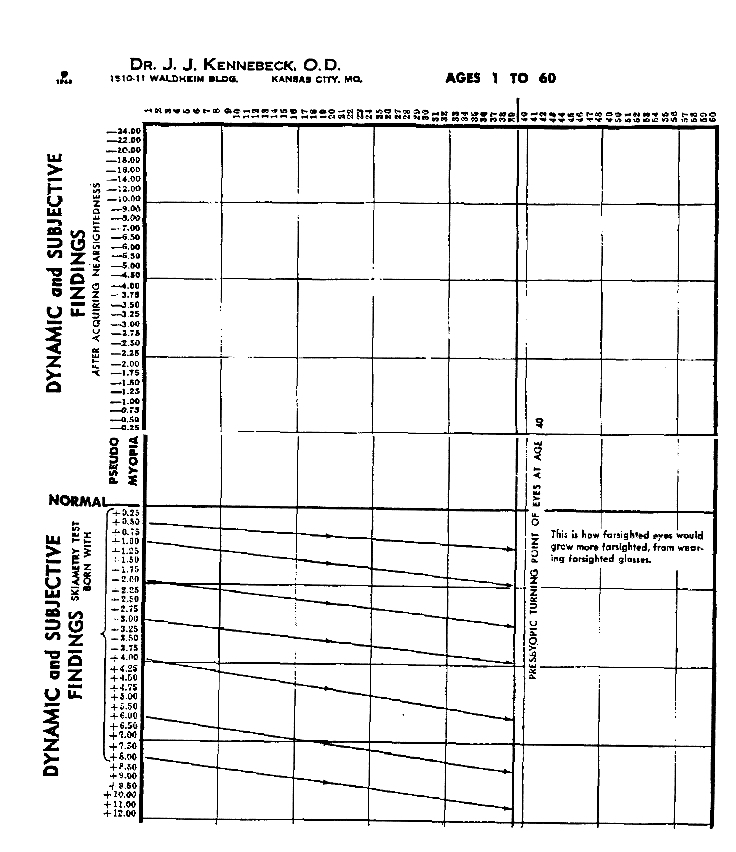
By this graph the designer would allow that glasses might be necessary, in most cases, in middle age and past, but to be best, at and past such age, glasses should not be the remedy, under that age, regardless of the condition. Though some such glasses may be necessary, the graph proves by analyzing cases, according to the lenses prescribed, over a period of time, that all eyes go worse and none get better by their use.
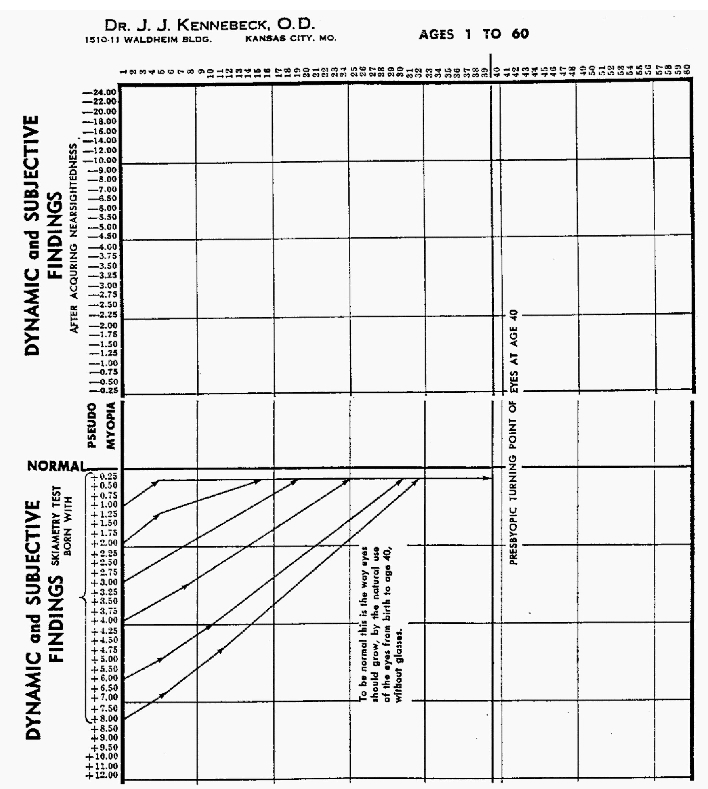
Explaining the graph: The numbers at the top show ages of eyes from age 1 to age 60, by years. The horizontal line, near the middle, is the normal line. The vertical line, near the right middle, at age 40, is the turning point of most all eyes, when, even if they were normal to age 40, they will begin to lose their power to read or do close work.
Below the normal line is Hypermetropia, or farsightedness, as shown by lenses numbered and with plus sign, as found in Dynamic Skiametry and Subjective Test findings, which could be the same, only in a perfect normal eye, otherwise, never the same, even with glasses unless corrected by a method other than glasses.
Above the normal line is Myopia, or nearsightedness, as shown by Pseudo Myopia and numbers with minus sign, as found in Dynamic Skiametry or Subjective Test findings, which are never the same, in any such conditions. The words Pseudo Myopia and the numbers show danger in minus lenses and Pseudo Myopia, which leads to Progressive Myopia, a condition known and feared by all eyemen, yet is brought on by the wearing of glasses at a young age, at all distances, that are only near scientific at the distance they were fitted (usually 20 feet) or beyond. Progressive Myopia can also be brought on by the misuse of eyes, even without glasses, but not as high a degree as with glasses. The words Pseudo Myopia mean beginning or false nearsightedness.
Both above and below the normal line the numbers denoting lens powers are spherical, or average power of a combined Rx, including Astigmatism, or can be used for simple Astigmatism. However, Astigmatism is slowly progressive, while Hypermetropia and Myopia, which is combined with it, Dynamically, in most cases, are fast progressive where glasses are worn. So, low degrees of Astigmatism in most cases are ignored in favor of showing the past, present and future of Hypermetropia and Myopia, where the more or less history of the case is known.
Directions: Obtain copies of prescriptions of all glasses worn, and at what age, to date, or at least, if possible, the first pair and last, and at what age obtained. Mark a dot where the Rx space and age meet, for every change that has been made. Then draw a line from the normal line to first dot, then from dot to dot. Thus it will be seen how fast and how far the eyes have gone from the normal line. So-called normal visual acuity with glasses should be classed as artificial normal visual acuity. While it is easy to believe that glasses save eyes and hard to understand that they don't, the graph shows that glasses take eyes farther and farther from the normal line, and do not save eyes.
This graph was designed under a complete new theory and method for eyes, discovered some forty years ago, carried on carefully and quietly through these years, in private practice, on thousands of cases, by the discoverer, J. J. KENNEBECK, O.D., KANSAS CITY, MO.
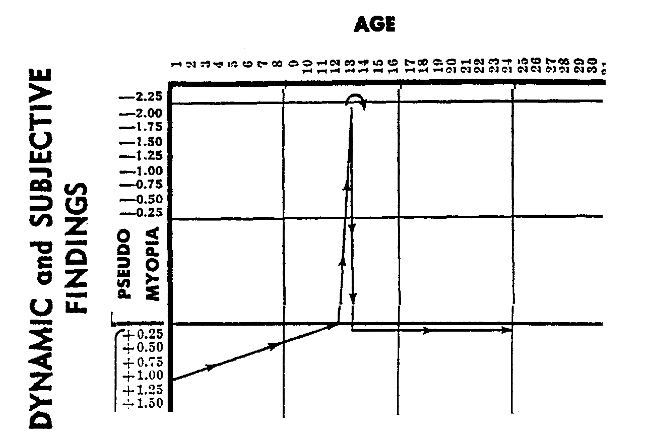
His vision checked normal for seven years, up to age 13, when suddenly he went nearsighted (minus 2.00 diopters), as described in my script, from collecting stamps and coins, lying on his stomach on the floor, with no more light than that which came from the television screen in an otherwise darkened room. Caught in time, his vision returned to normal within two weeks and has held ever since, and without glasses. He had to stop at once that which caused his nearsightedness.
Exactly the same thing is happening to millions of other children and young people under the age of thirty-five. Caught in time, all the millions can be helped as John R. was helped.
While I have shown the case of John R. starting out with dynamic skiametry findings of plus 1.00, no doubt he was born with plus 2.00 to plus 4.00 diopters. However, the lines shown should serve the purpose. Any and all cases could be similarly charted on the graph, depending on the findings, as was the case of John R. All such cases started out with plus, which is natural, and sooner or later changed into minus, which is unnatural, meaning that they changed from farsightedness into nearsightedness. Then all cases grow progressively worse from there unless they stop all bad eye habits and never resort to nearsighted glasses.